

Core Plus Mathematics Course 1 Unit 1 Answers
Core-Plus Mathematics: Course 1, Unit 1, Lesson 2 Review
![]()
The second lesson in the Course 1 of Core-Plus Mathematics is called "Change over Time".
Investigation 1: Predicting population change
Here is a paragraph from the textbook, which sets the level of the discussion:
Based on recent trends, births every year equal about 1.7% of the total population of Brazil, while deaths every year equal about 0.6% of the total population of the country.
Which of these strategies for estimating change in Brazil's population from one year to the next uses the growth rate data correctly? Be prepared to justify your answer in each case.
a. 0.017(current population) — 0.006(current population) = change in population
b. 0.011(current population) = change in population
c. 0.17(current population) — 0.06(current population) = change in population
d. 1.7%(current population) — 0.6% = change in population
The textbook pompously calls a simple arithmetic expression a "strategy" at the same time questioning students' understanding of percents (middle school stuff) and distributive property (elementary school stuff).
Next, the textbook asks students to calcula t e population — this time of whales — in the years ahead, given that year-to-year increase remains at 3% of the previous year, but 50 of the whales are hunted and killed each year. This number, 50, complicates the formula, which otherwise could be derived by students themselves.

Indeed, if we let us forget about the 50 whales killed each year, then we would have a much simpler relationship between current and next year population, which is known as compound interest formula.
Here Yn is the population in the Yth year, and r is yearly change as a fraction, in our case r = 1 + 0.03 = 1.03
Instead, the Core-Plus textbook shoots itself in the foot by making the problem more realistic, where population of whales changes not only because of steady yearly increase (percentage of the previous year), but also because of hunting (constant number). In this case the problem becomes more complicated, and one needs a certain ingenuity to derive a generic formula for any arbitrary year. Still, this can be done, and the resulting formula is not very scary

For example, here is the population of whales nine years from now, which comes to 9538.798209… well, to 9539 rounded to integer (compare with the calculator's results in the screenshot below):

The Core-Plus course is not interested in teaching students generic formulas of geometric series, it is interested in peddling "technology". So the book builds a formula for the next year using data from the current year, and then suggests using calculator to get results for consecutive years by pushing the Enter button repeatedly.

Amazing what technology can do, isn't it? What if one wants a projection thousand years ahead? I suppose we will have to write a program which will effectively press Enter for us by creating a loop. Yes? No. Writing loops is way too advanced.
Investigation 2: Using electronic spreadsheets
Make no mistake, spreadsheet apps like Excel are amazing invention, but there should be time and place for them. The sort of the problems the Core-Plus Math textbook deals with do not require usage of a spreadsheet, so I shall not discuss this topic any further.

Connections and Reflections
The textbook mentions Fibonacci sequence as a pattern that "appears many places in nature" (sic!). This is the 3rd edition of the textbook, and for quarter of a century this spelling error has not been fixed.

There is a pretty photo of sunflower without explanation where exactly Fibonacci sequence can be found in sunflower. Then the book suggests modifying the spreadsheet to calculate Fibonacci sequence.
Then there is a completely unrelated task for calculating mean and median of a bunch of numbers, and as it is customary for the Core-Plus course, these terms are not defined beforehand, for example: "What were the mean and median population change for the listed cities?" Does the book expect students to learn these terms in middle school?
This lesson also keeps using the word "rate" without defining it. The closest the textbook gets to defining rate is the first lesson, where in an example of different kinds of change it says that a change of 0.5 inches per month can be thought of as "an average rate of change". In this lesson the textbook shows a graph describing the change in the amount of water in a reservoir, and asks questions about where the rate of change is fastest, slowest or constant. I was looking forward for the introduction of derivative…
If you are interested, rate is a ratio between two related quantities having different units, meaning that if you are driving from San Diego to Los Angeles, which is 120 miles, and you already drove 60 miles, than 60 miles / 120 miles is not a rate, but just a ratio, a portion of the whole distance driven, it is 60/120 or 0.5, no units, also called dimensionless quantity. You just covered 0.5 of the whole distance.
On the other hand, if you drove 60 miles within an hour, then 60 miles / 1 hour is a rate, and not just any kind of rate, but so-called temporal rate: 60 miles PER hour, or 60 miles/hour.
Some other temporal rates are acceleration, power, frequency, radioactive decay and many others that often have "rate" in their name.
In colloquial usage "rate" without qualifiers usually means speed: the rate of change of position, or the change of position per unit of time.
Extensions
The Extensions section of Lesson 2 shows a graph of a sinusoidal function aka sine wave by using Ferris wheel as an example without naming it sinusoidal function. "Connect the points if it seems to make sense to do so," says the textbook.
It also asks to calculate circumference and area of a circle using well-known formulas without attaching this task to an exercise, even the simplest one like flying around the world or figuring out how much water would be needed for a round rink. Nope, just calculate circumference and area of a circle, any circle.
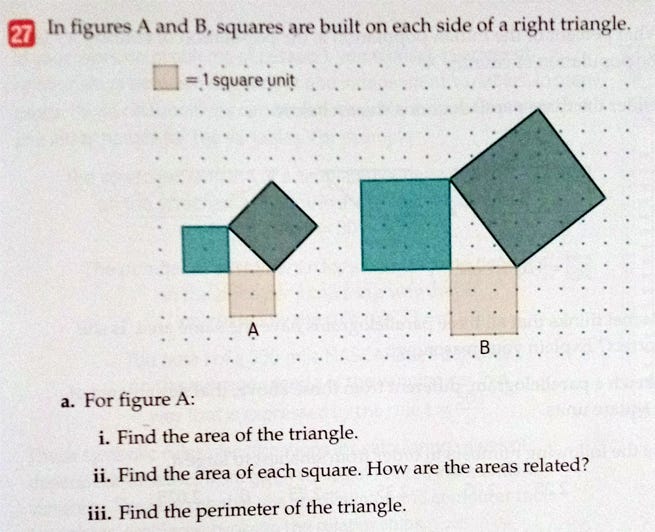
There is also a classic illustration for the Pythagorean Theorem, the book even mentions the theorem, but does not prove it. Instead it asks students to calculate area of the squares and of the triangle, thereby, supposedly, asserting the correctness of the theorem.
The closest the textbook comes to prove the Pythagorean Theorem is in Unit 6, where it shows two different constructions, yet does not present a rigorous proof, instead asking students to "Study the diagrams below of a right triangle, a square built on the hypotenuse of the triangle, and an arrangement of congruent copies of the triangle around the square" and then to explain how it works, basically, to produce their own proof.
The textbook expects too much from students who, presumably, barely know how to use decimal fractions and percents.
Are you having fun? I told you that Core-Plus is not a math book.
Coming up in the Lesson 3
- Word problems!
- Rectangle, parallelogram, obtuse triangle, right triangle, isosceles triangle, circle — no definitions.
- Solving p(50-p)=500 on a calculator.
- Equation — what is it?
- Patterns of Algebra: plotting graphs of linear, quadratic, exponential, reciprocal functions. No need to solve anything. No word about polynomials.
- Area of triangle and circle, perimeter, volume of cube — no definitions, no proofs.
Core Plus Mathematics Course 1 Unit 1 Answers
Source: https://reflectiveobserver.medium.com/core-plus-mathematics-course-1-unit-1-lesson-2-review-8894dd2a54d4
Posted by: grahamladmoultan.blogspot.com
0 Response to "Core Plus Mathematics Course 1 Unit 1 Answers"
Post a Comment